Project
Seatgeek
Leading infographics for major sports events.
Project
Leading infographics for major sports events.
| Client | Seatgeek |
| Date | 2011—2013 |
| Services | Infographic design Email assets |
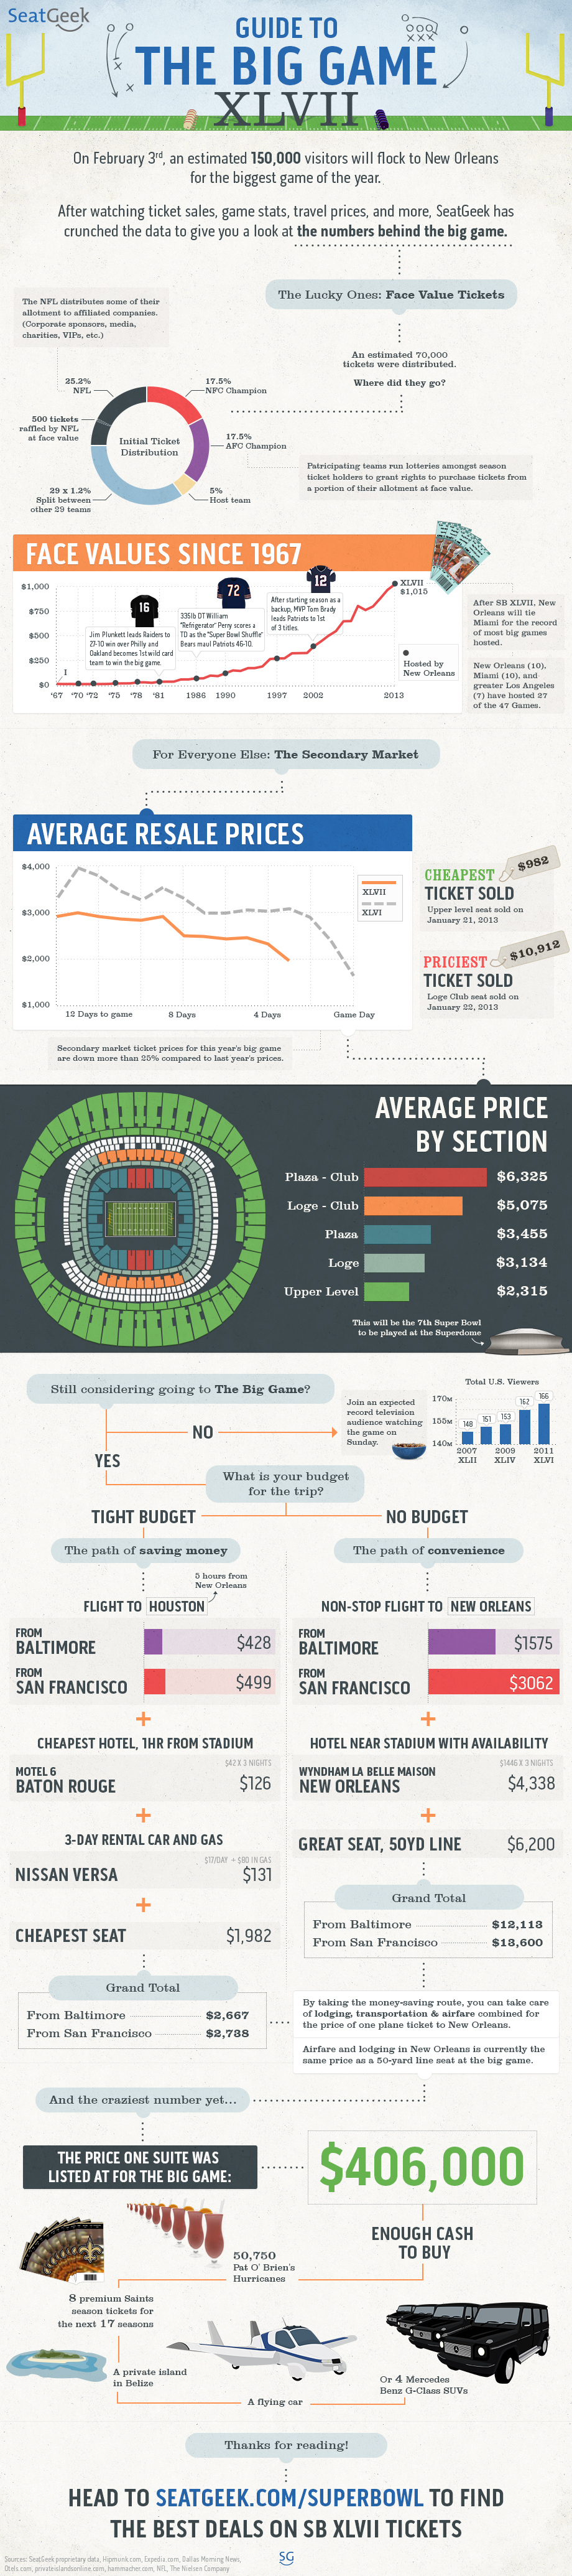
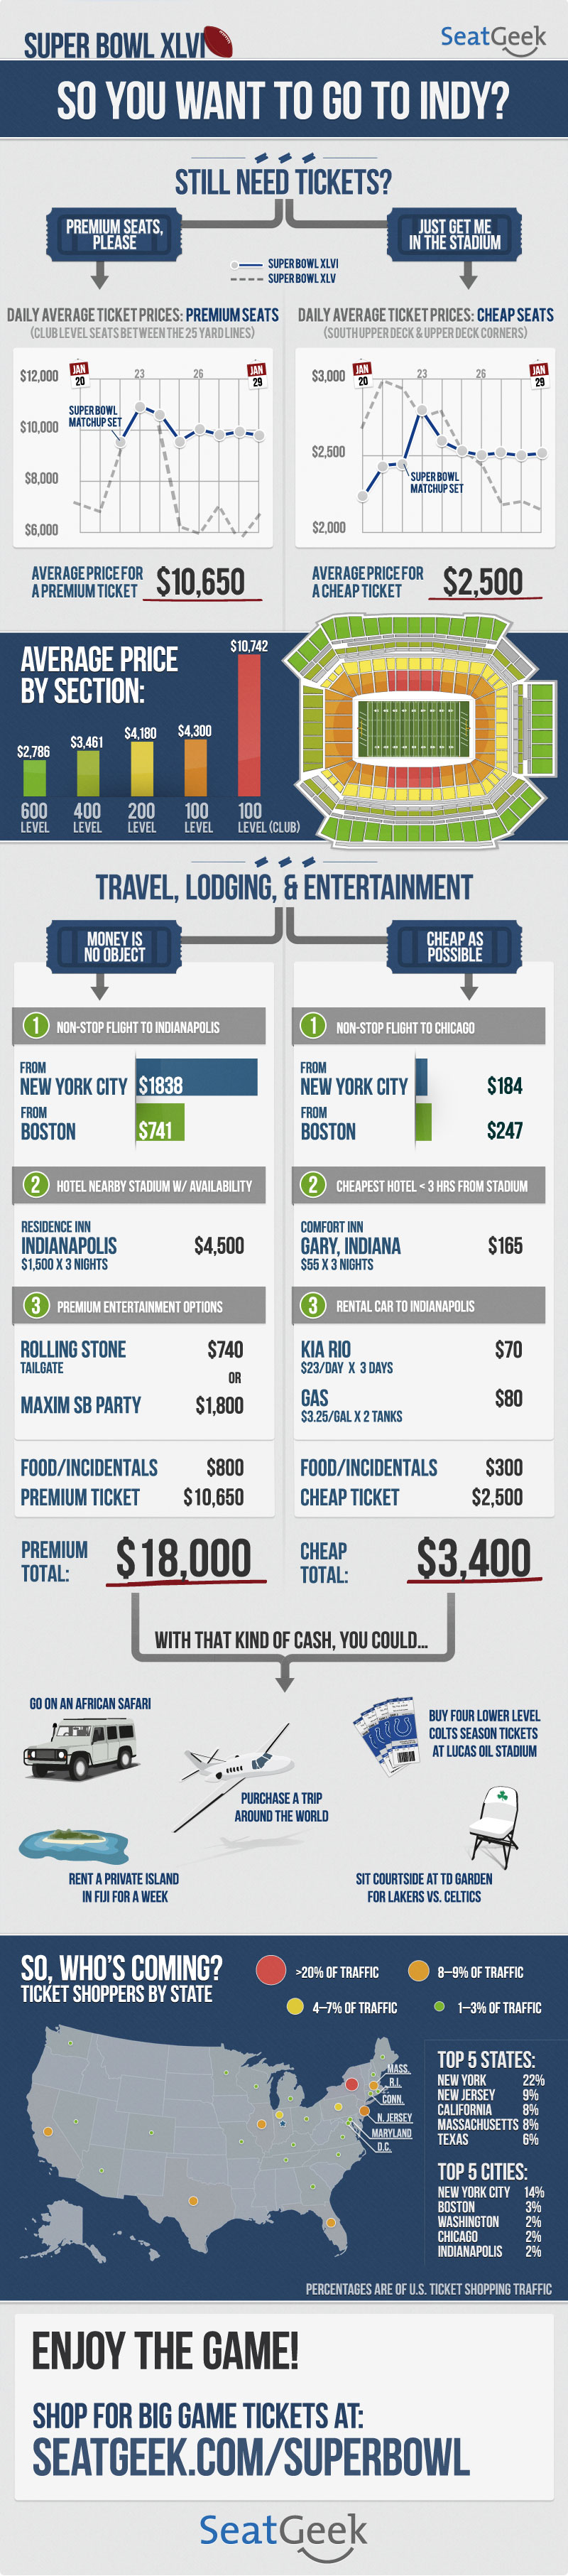
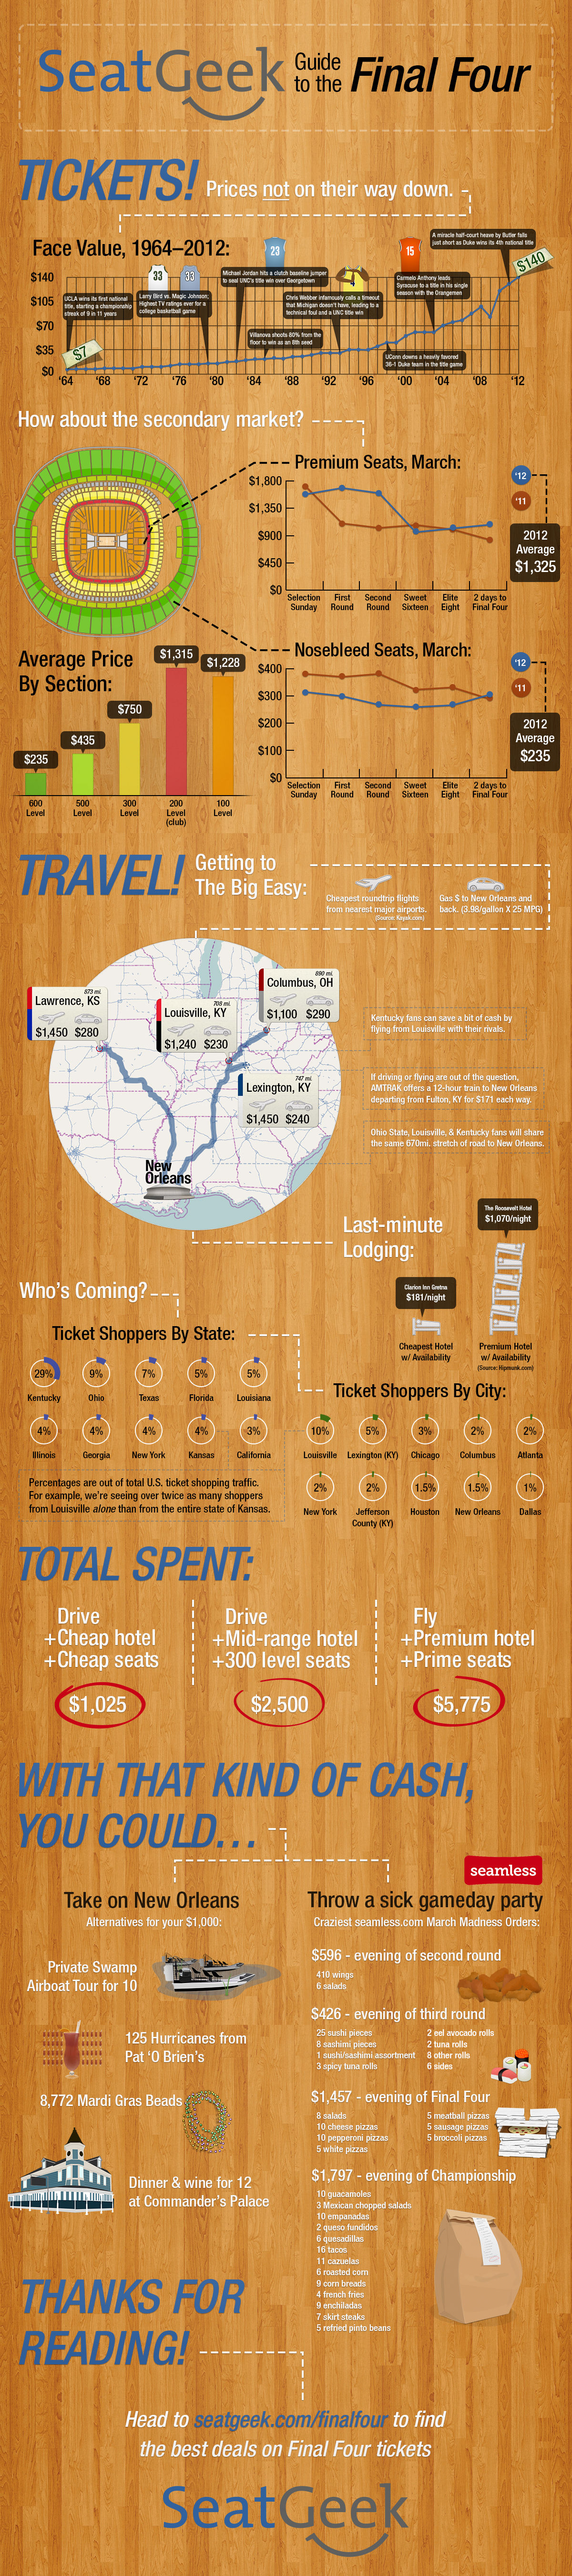
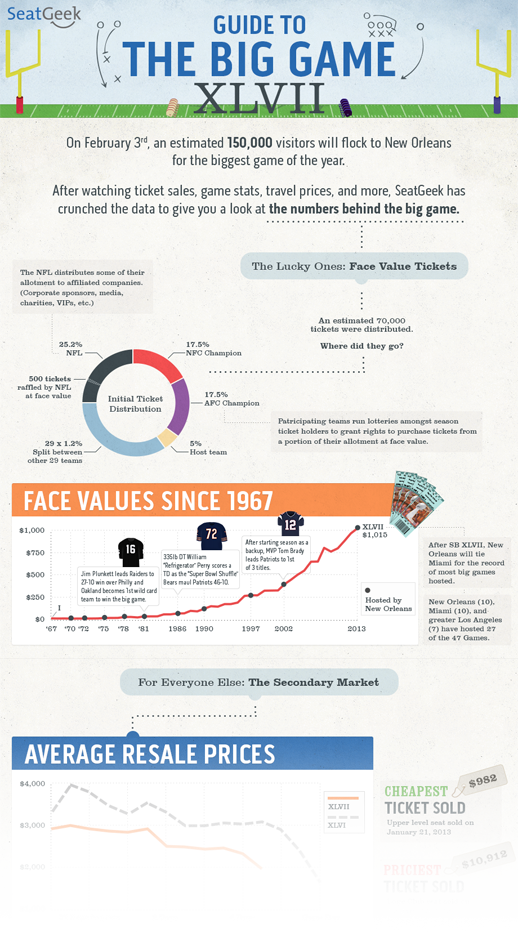
I've teamed up with SeatGeek to create infographics for a couple major sporting events. Using their data, we looked at the best times to buy tickets, average prices per stadium sections, and just for fun: cheapest and most expensive travel options for each event alongside wild alternatives to what you could do with that money.
With the exception of a couple maps, all illustrations were created from scratch for the graphics.
The resulting graphics have garnering thousands of views, "staff pick" placements on leading infographic website visual.ly, coverage by NBC Sports and sydication through the entire CBS news blog network.